Control via Billing Portal
In addition to the Server Control Panel you can control your HostVenom Server remotely using the Billing Portal.
Locating
You can easily locate the Control Area for your service in the HostVenom Billing Portal by logging into the Billing Portal and selecting the "Manage Service" button on the service you want in the "Active Products/Services" pane.
You can also pick the service you want by clicking "View Details" in the "Your Active Products/Services" panel on the homepage!
Loading...
Server Details / Additional Information
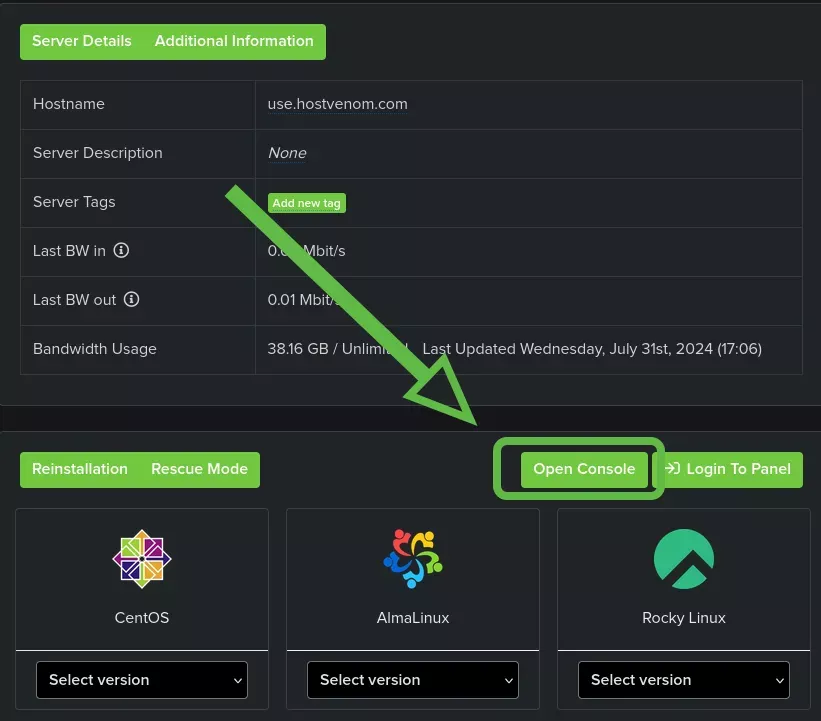
You can find a significant amount of information about your VPS Service in the "Server Details/Additional Information" pane.
Server Details
- Hostname
- A human readable name for you and other computers to identify, can be nearly anything you want.
- Server Description
- A description for your server used in the panel.
- Server Tags
- Short descriptors for your server that can be used to group it with other servers when using the API or performing searches.
- Last BW in
- The most recent Bandwidth In measurement.
- Last BW Out
- The most recent Bandwidth Out measurement.
- Bandwidth Usage
- Your total Bandwidth Usage for this billing period.
Additional Information
- Operating System
- Your servers current operating system. Can be updating by reinstalling.
- Core(s)
- The current number of CPU Core(s) allocated to your server and it's associated cost. Can be changed by upgrading or downgrading.
- Memory(GB)
- The current amount of RAM in GB allocated to your server and it's associated cost. Can be changed by upgrading or downgrading.
- Disks Space
- The current amount of RAM in GB allocated to your server and it's associated cost. Can be changed by upgrading or downgrading.
- IPv4 Addresses
- The total number of IPv4 addresses assigned to your server.
- Bandwidth
- Your service's total Bandwidth Cap.
Power Control
Power Off
Power Off your server by sending a "Shut Down" signal, giving your server a chance to safely respond. Leaves the server in a powered off state.Reset
Forcibly shut down and restart your server. Does not let the server respond before shutting off.Reboot
Restarts the server by sending a "Restart" signal, giving your server a chance to respond and the server will immediately restart itself. Some things require a full "Power Off" and "Power On" in order to complete safely.Power On
Power On the server when it's off. Will only be visible when the server is Offline.
Loading...
If you've changed your package and your server's resources need to be resized, you need to Power Off and then Power On your server instead of using the Reboot/Reset buttons.
Reinstallation
You can install or reinstall a number of default operating systems and versions using the "Reinstallation" section. Located under the "Server Details/Additional Information" pane, you can use this area to either install a fresh copy of the operating system you already have, or switch to another one.
Need or want an OS that isn't listed? Reach out to us via a Support Ticket and we'll see what we can do!
This process is destructive and will remove all of the data currently on your server.
We do not take backups of VPS/Dedicated servers at this time.
To install or reinstall an operating system that's already listed, simply follow the steps below:
Power Offyour server.- Open the "Select version" drop down of the operating system you want to install.
- Select the version you want to install.
- Fill out the provided configuration options.
- The hostname can be nearly anything you want. It's just a label for your device meant to be readable to humans like you!
- Click
Start Reinstallation.- Remember, this is destructive!!
After you start the installation, you should be presented with a modal similar to the one show to the right showing the progress of the installation.
If it does't complete after 5 minutes, reach out to us via a Support Ticket and we'll do everything we can to assist you!
Loading...
Console
You can open a NoVNC session from the Billing Portal by selecting the "Manage Service" button for your server from the "Active Products/Services" list then scrolling down below the "Server Details/Additional Information" pane. Next to the "Reinstallation/Rescue Mode" buttons is the Open Console button which will open a new tab containing the NoVNC session.
 Loading...
IP Assignments
The IP Assignments table contains information about the IP addressees assigned to your VPS service and their associated information.
Loading...
Locating IP
You can use the IP Assignments table to locate your server's IP if you've forgotten it. The first column of the table titled "IP" contains the public IP Address's of your VPS.
Loading...
RDNS
You can configure your server's rDNS using the "RDNS" column of the IP Assignments table. Just click on the entry for the IP you want to change and enter the value you need.
Loading...
Graphs
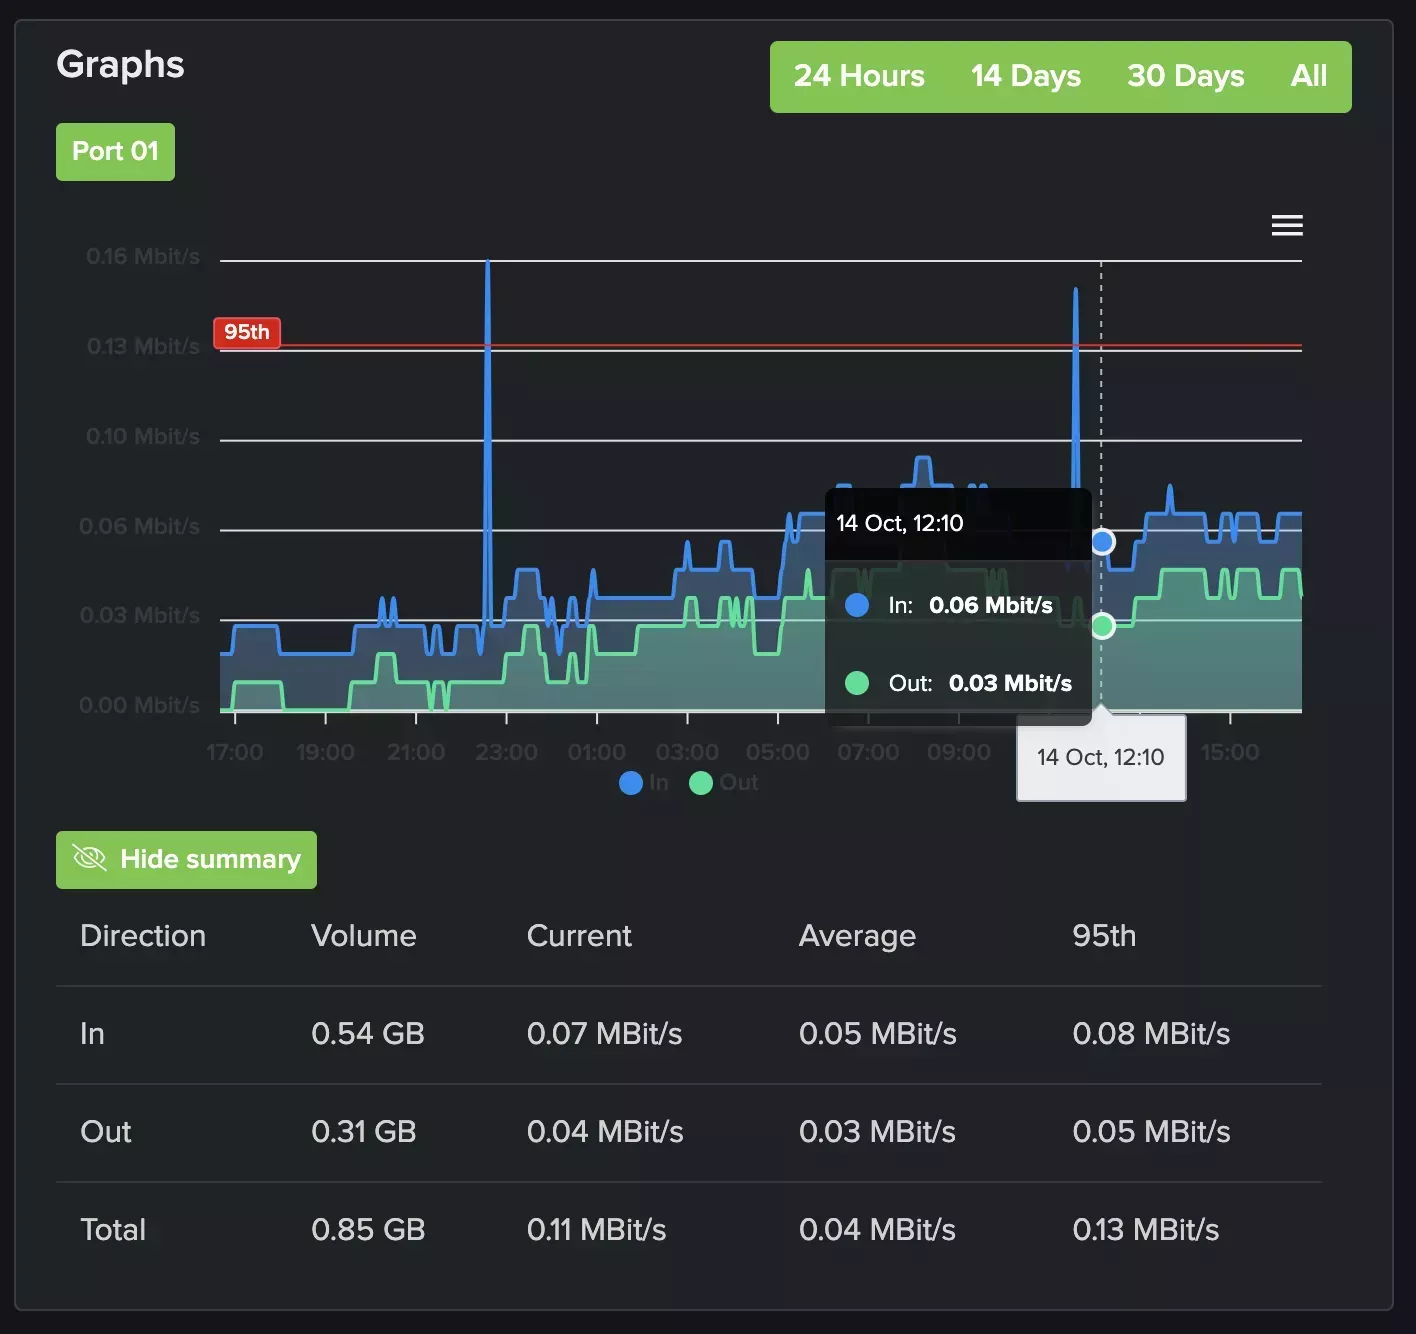
The "Graphs" pane shows your server's network traffic by port and can display information from the past 24 Hours, 14 Days, 30 Days, or using all of the available data.
The upper part of the pane contains the actual graph and the lower half contains a table with a summary of your network traffic over the selected period.
You can download the data as an SVG or PNG rendering of the current graph or a CSV of the data itself using the hamburger menu on the top right of the graph.
 Loading...
Loading...